> For the complete documentation index, see [llms.txt](https://docs.catanatron.com/llms.txt). Markdown versions of documentation pages are available by appending `.md` to page URLs; this page is available as [Markdown](https://docs.catanatron.com/advanced/data-and-machine-learning.md).
# Data and Machine Learning
## Generating Data
Using the CLI you can generate data, suitable for Machine Learning and Data Analysis.
#### CSV
With `--output-format csv` you can generate the CSVs like so:
```bash
catanatron-play --num 5 --players F,F,R,R --output data/ --output-format csv
```
This generates 4 GZIP CSVs:
* **samples.csv.gz:** One row per game state at each [ply](/core-concepts.md).
* **actions.csv.gz:** Integers representing actions taken by each player at each ply.
* **rewards.csv.gz:** Some common returns and rewards with which to label how effective actions taken by bots where. See Reinforcement Learning section on [Gymnasium Interface](/advanced/openapi.md)
* **main.csv.gz:** Simply a concatenation of the above 3 CSVs
Using `--output-format csv` will continuously simply append to these 4 files more and more plys even if from different games.
#### Parquet
[Parquet format](https://parquet.apache.org/) is also supported. One file per game is generated (like in JSON format)
```bash
catanatron-play --num 5 --players F,R --output data/ --output-format parquet
```
## Board Tensors
Representing the Catan Board State for Machine Learning purposes is challenging using tabular data. The best we can often do is have many features like `TILE11_IS_BRICK` or `TILE3_PROBA` to represent what resource and what number lie in what tile. Similarly columns like `NODE9_P2_CITY` and so on to represent if Player 2 has a City in Node 9.
To aid in this regard, you can also generate a 3D Tensor for each game state capturing the spatial relationship of these features. You can generate it when using `--output-format parquet` or `--output-format csv` by using the `--include-board-tensors` flag.
For example:
```bash
catanatron-play --num 5 --players AB:2,AB:2 --output data/ --output-format csv --include-board-tensor
```
Its a dedicated flag since it makes simulations a bit slower.
### Dimensions and Channel Descriptions
One sample has shape `(WIDTH=21, HEIGHT=11, CHANNELS=2*N+12)` where CHANNELS depend on the number of players of the game `N`.
#### Player Building Channels (Indexes: 0 to 2N - 1)
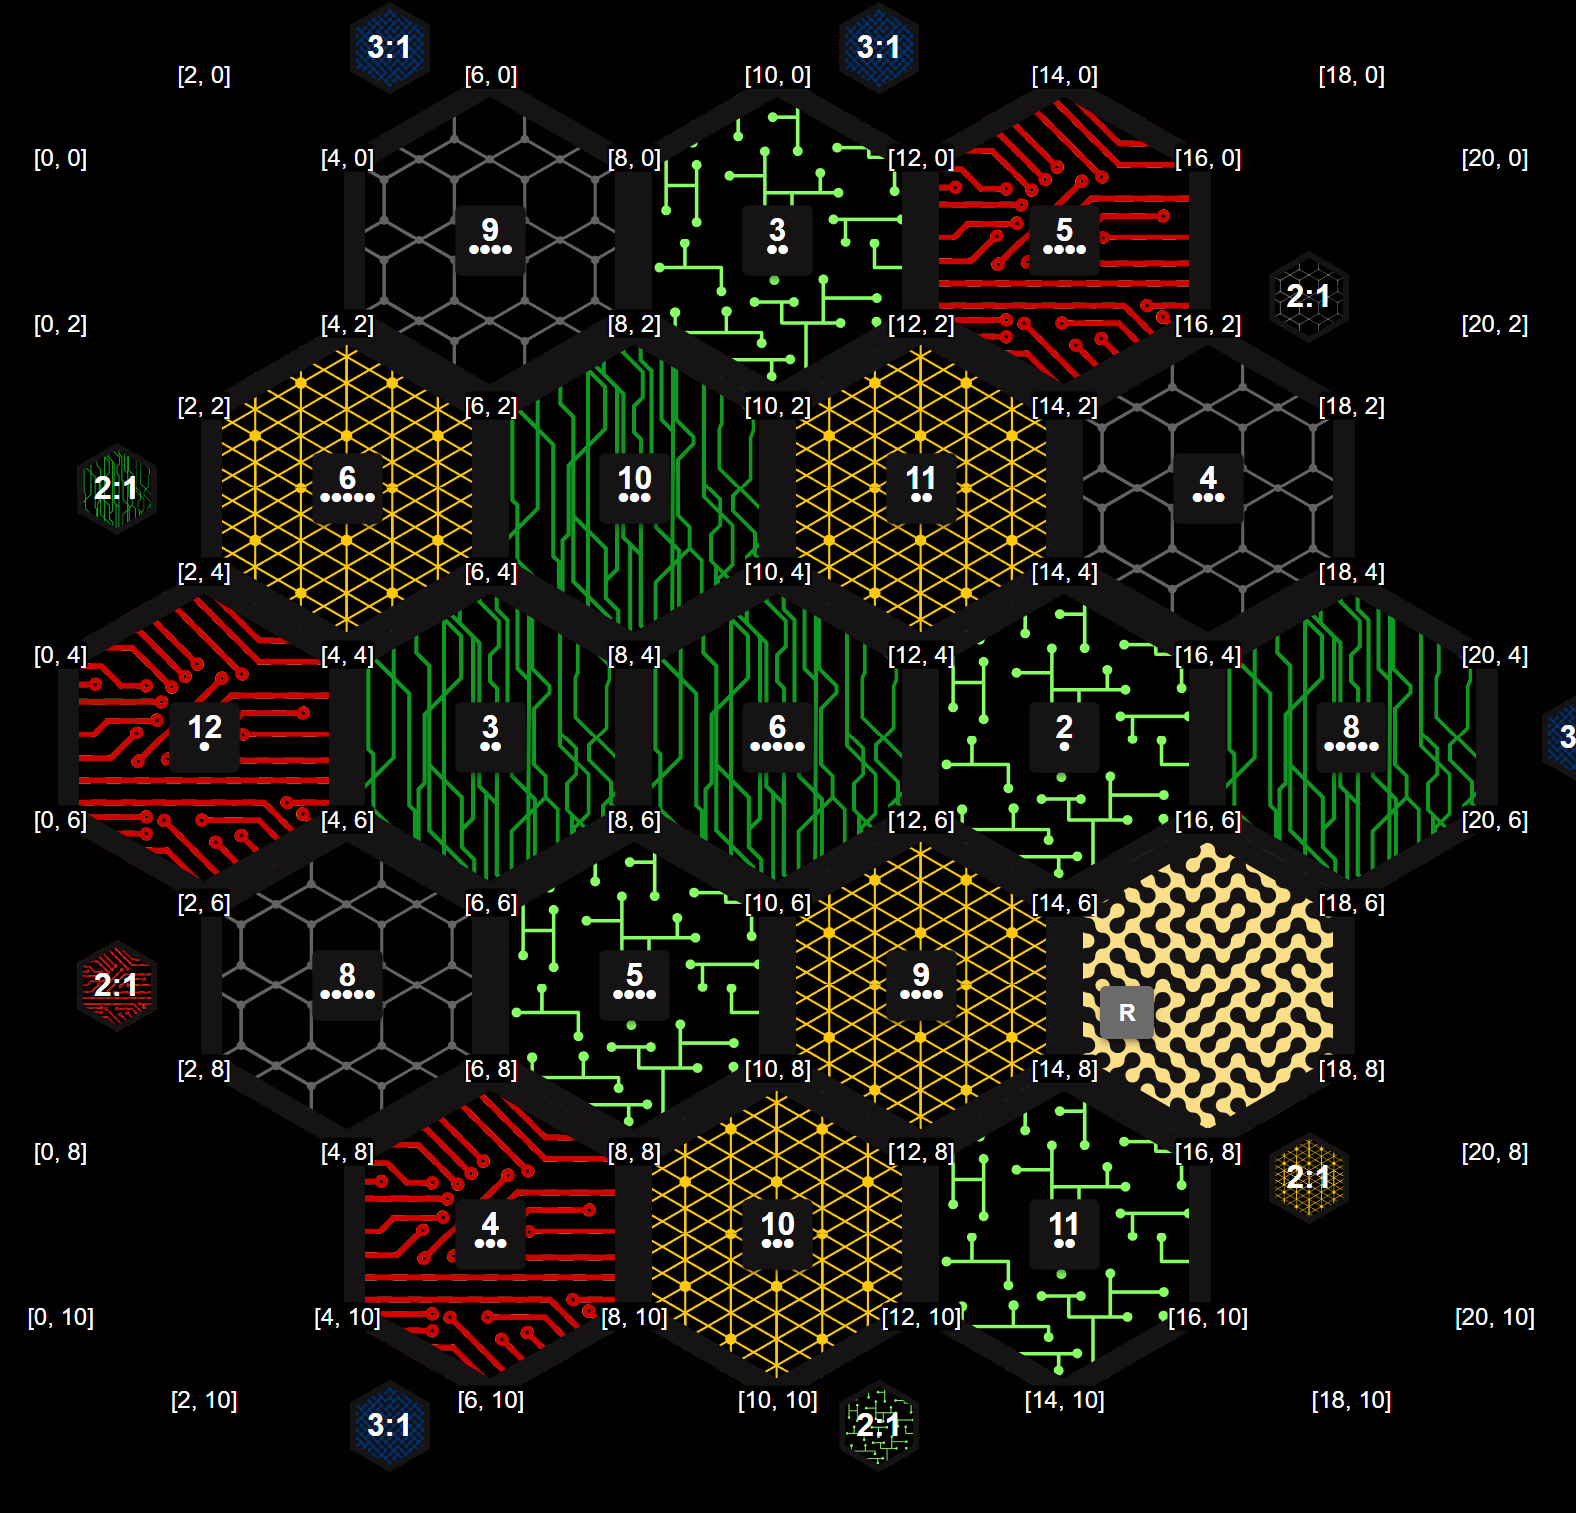
If a Player 0 (the player with the perspective from which we take the sample) has a settlement in the 8 ORE - 5 SHEEP - 4 BRICK node below (the one marked as \[6, 8]), then that means `board_tensor[6, 8, 0]` would be `1`. If it was a city, it would be `2`
If Player 3 has a road between the 10 WOOD and 11 WHEAT, the coordinate `board_tensor[10, 3, 2]` would be `1` (2 meaning that it is player 3). The vertical "edges" are captured in the odd rows of the tensor.
#### Tile Channels (Indexes: 2N to 2N + 4)
If there are `N` players, channels `2N` to `2N + 5` talk about the resource yield of each node. The following is an index map of the nodes.
So for example... `board_tensor[6, 2, 8]` in this board for a 4 player game should be `0.08333333333333333` since the probability of rolling a 10 is \~8.33% and this is the first resource plane (which corresponds to Wood). It is also the case for `board_tensor[8, 2, 8]` and `board_tensor[10, 2, 8]` .
But for `board_tensor[6, 4, 8]` it should be the probability of rolling a 10 or a 3 (\~5.55%), so it should give `0.1388888888888889`.
#### Robber Plane (Index: 2N + 5)
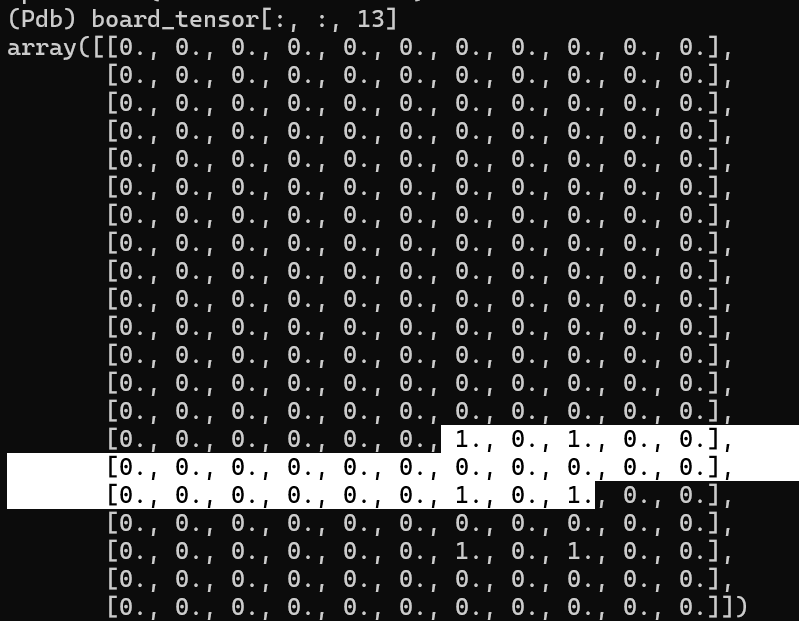
There is a robber plane that places a `1` on all nodes of the tile it is blocking. As shown below for example (this is the desert above).
#### Port Planes (Indexes: 2N + 6 to 2N + 11)
There are 6 more planes with `1` if the node enables that trading rate. The 3:1 is the very last channel. So for example, for the above board, `board_tensor[6, 10, 19]` and `board_tensor[4, 10, 19]` are `1`, capturing the 3:1 port of the 4 BRICK tile.
---
# Agent Instructions
This documentation is published with GitBook. GitBook is the documentation platform designed so that both humans and AI agents can read, navigate, and reason over technical content effectively. Learn more at gitbook.com.
## Querying This Documentation
If you need additional information that is not directly available in this page, you can query the documentation dynamically by asking a question.
Perform an HTTP GET request on the current page URL with the `ask` query parameter, and the optional `goal` query parameter:
```
GET https://docs.catanatron.com/advanced/data-and-machine-learning.md?ask=&goal=
```
`ask` is the immediate question: it should be specific, self-contained, and written in natural language.
`goal` is optional and describes the broader end goal you are ultimately trying to accomplish on behalf of the user. GitBook uses it to tailor the answer towards what is most useful for that goal.
The response will contain a direct answer to the question and relevant excerpts and sources from the documentation.
Use this mechanism when the answer is not explicitly present in the current page, you need clarification or additional context, or you want to retrieve related documentation sections.